MATLAB is a great tool for quickly and easily generating plots of data and mathematical functions. However, the default appearance of plots in MATLAB isn’t well-suited for being included in papers and other formal reports. However, with a little bit of tweaking, we can get MATLAB to output plots styled much more appropriately.
Here’s a basic plot command which uses MATLAB’s default configuration:
x_data = 0:10;
y_data = x_data.^2;
plot(x_data,y_data);
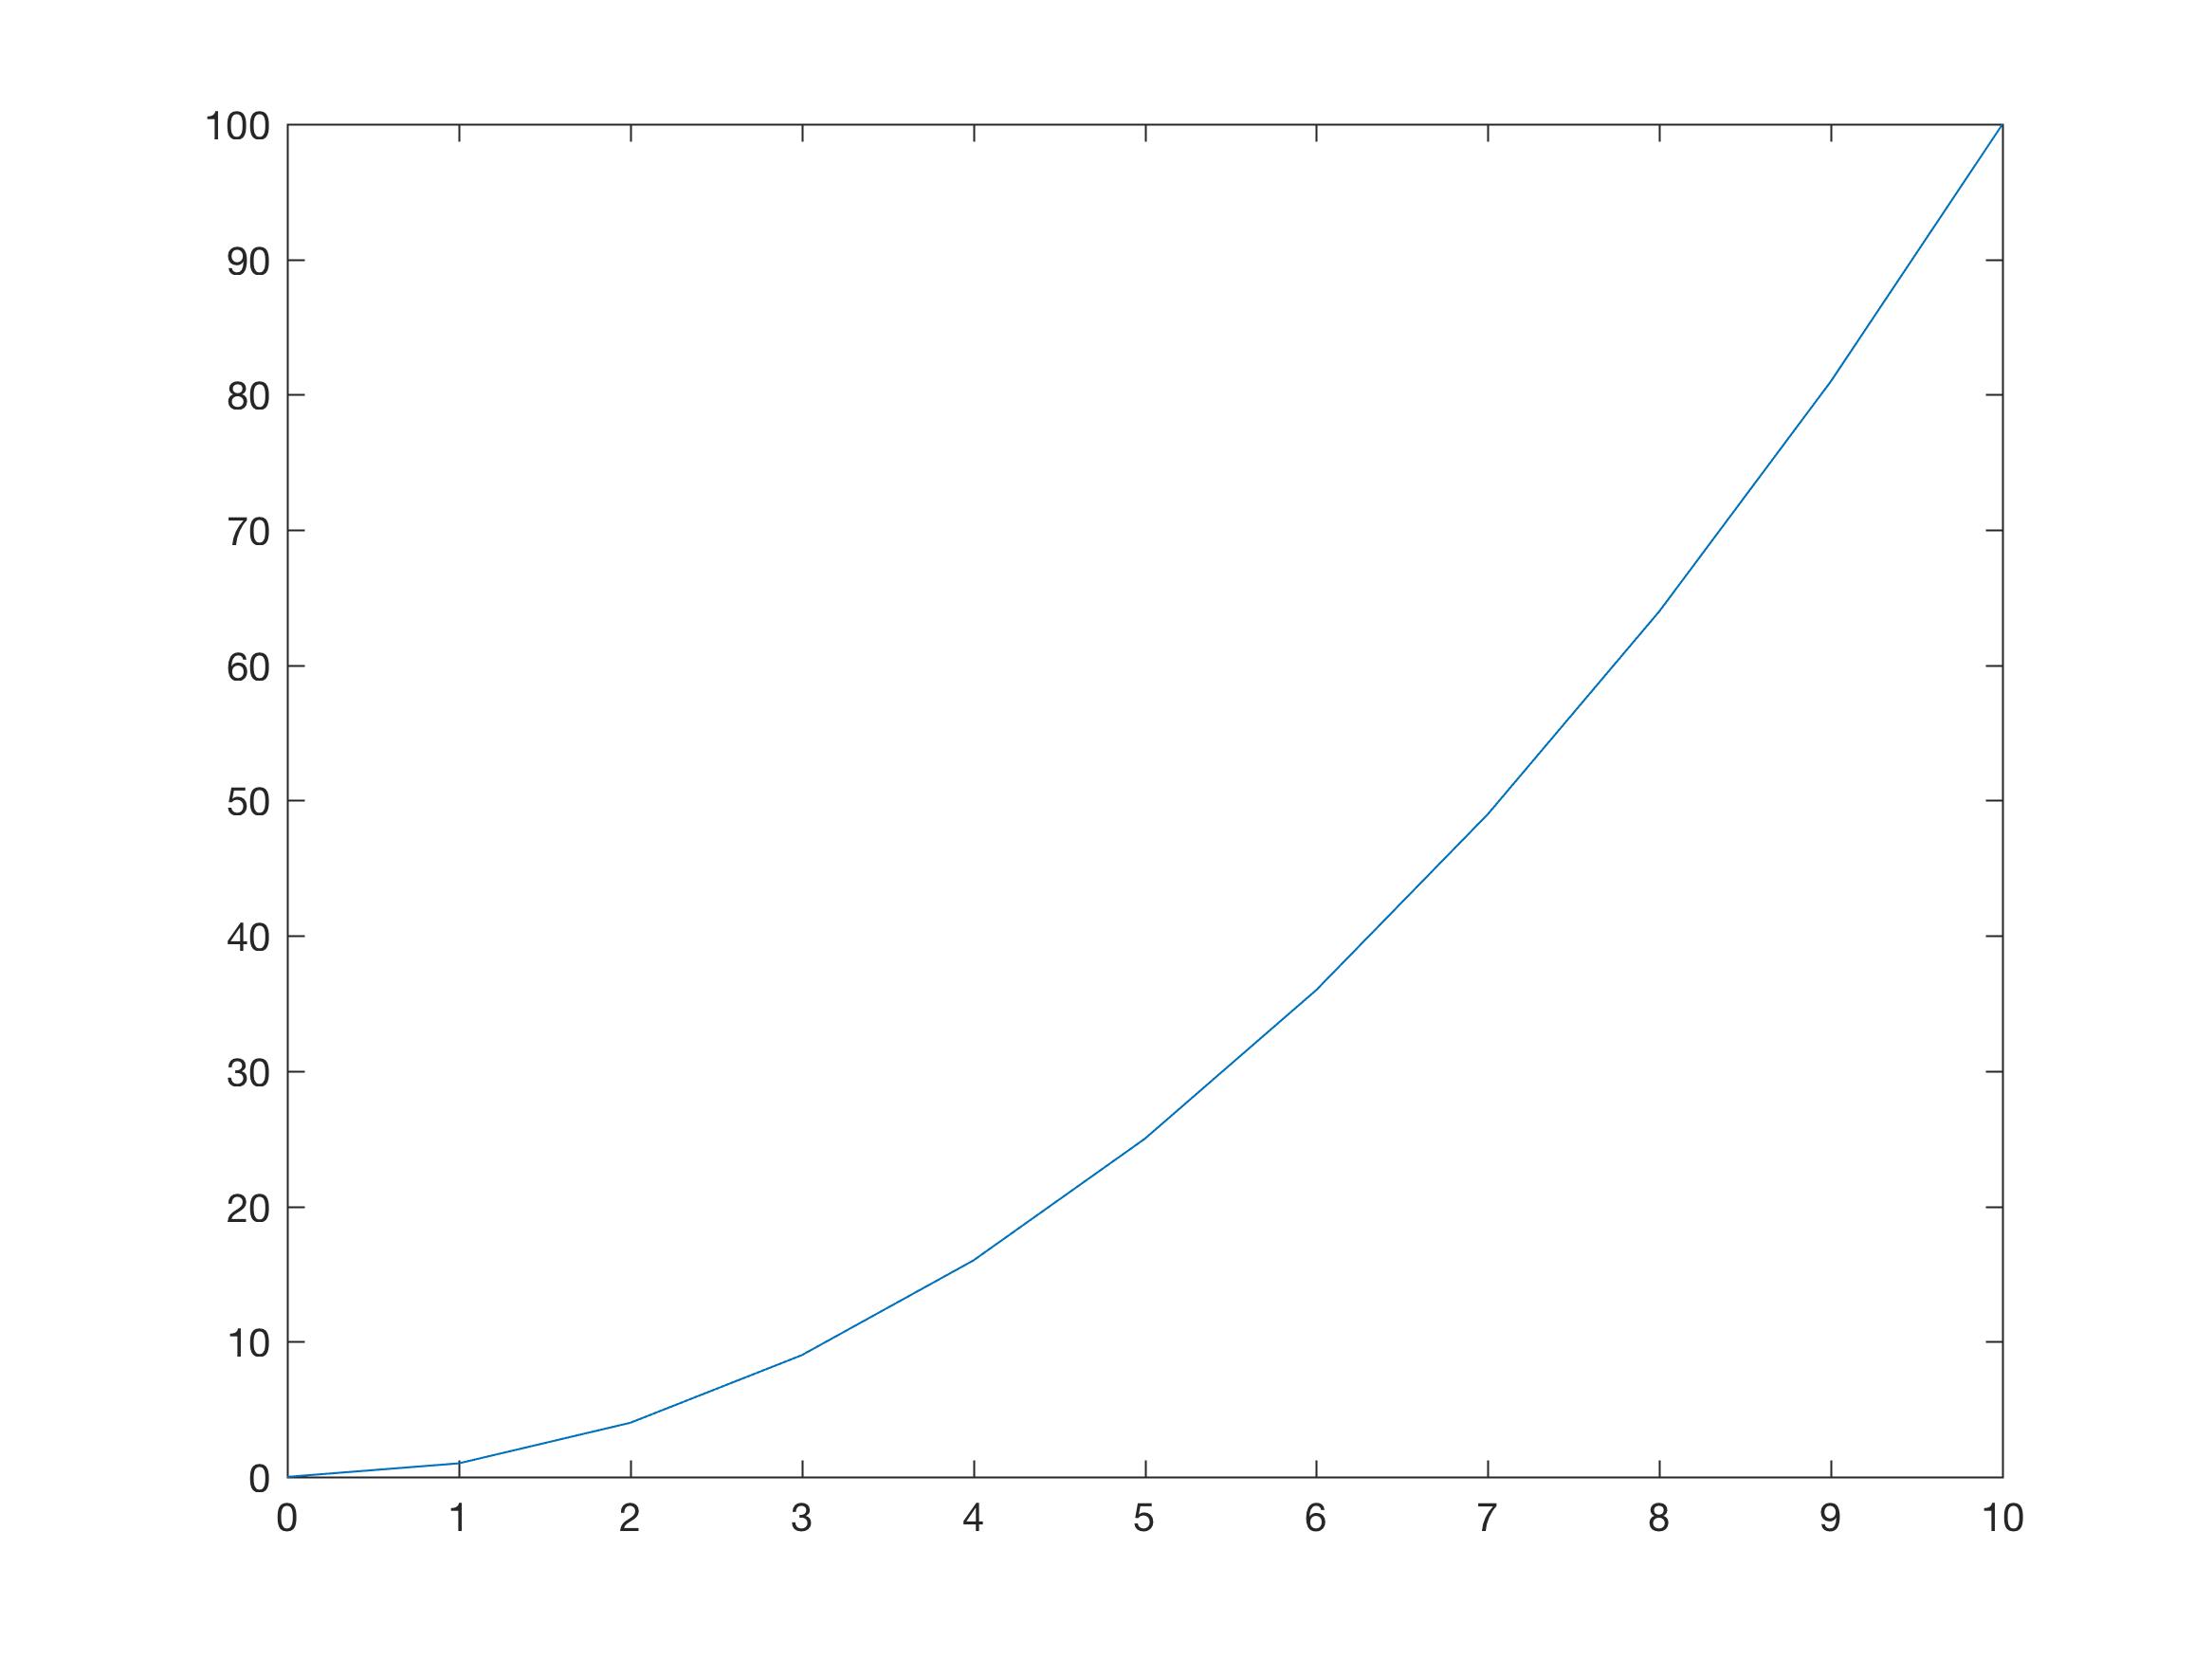 In its current form, this plot would not translate well at all to a professional document meant to be read on paper. So let’s add a few tweaks to get it looking much more presentable.
First, let’s define some parameters to be used for various aspects of the plot configuration:
% Define plot parameters
width = 4;     % Width in inches
height = 3;    % Height in inches
scale = 100;
alw = 0.75;    % AxesLineWidth
fsz = 9;      % Fontsize
lw = 0.5;      % LineWidth
msz = 5;       % MarkerSize
Then, let’s set up our figure:
% Set up plot
figure()
pos = get(gcf, 'Position');
set(gcf,'Position',[pos(1), pos(2), width*scale, height*scale]);
Once again, we plot our data:
% Define data and plot
x_data = 0:10;
y_data = x_data.^2;
plot(x_data,y_data,'k-','LineWidth',lw,'MarkerSize',msz);
We finish up by setting our styling and labels:
% Finish up plot
axis([x_data(1), x_data(end), y_data(1), y_data(end)]); % define plot boundaries
xticks([0, 2, 4, 6, 8, 10]);
yticks([0, 25, 50, 75, 100]);
xlabel('x-axis',...
       'FontUnits','points',...
       'FontSize',fsz,...
       'FontName','Times');
ylabel('y-axis',...
       'FontUnits','points',...
       'FontSize',fsz,...
       'FontName','Times');
set(gca,...
    'Units','normalized',...
    'FontUnits','points',...
    'FontWeight','normal',...
    'FontSize',fsz,...
    'FontName','Times',...
    'LineWidth',alw,...
    'XColor','k',...
    'YColor','k');
Optionally, we can save the output image to a file of various formats:
% Output to file
set(gcf,'InvertHardcopy','on');
set(gcf,'PaperUnits', 'inches');
papersize = get(gcf, 'PaperSize');
left = (papersize(1) - width)/2;
bottom = (papersize(2) - height)/2;
myfiguresize = [left, bottom, width, height];
set(gcf,'PaperPosition', myfiguresize);

% Use '-dpdf' for PDF format, or '-depsc2' for EPS format
print('filename','-dpdf');
The file will be generated in the same directory as your code.
Here’s what the plot now looks like:
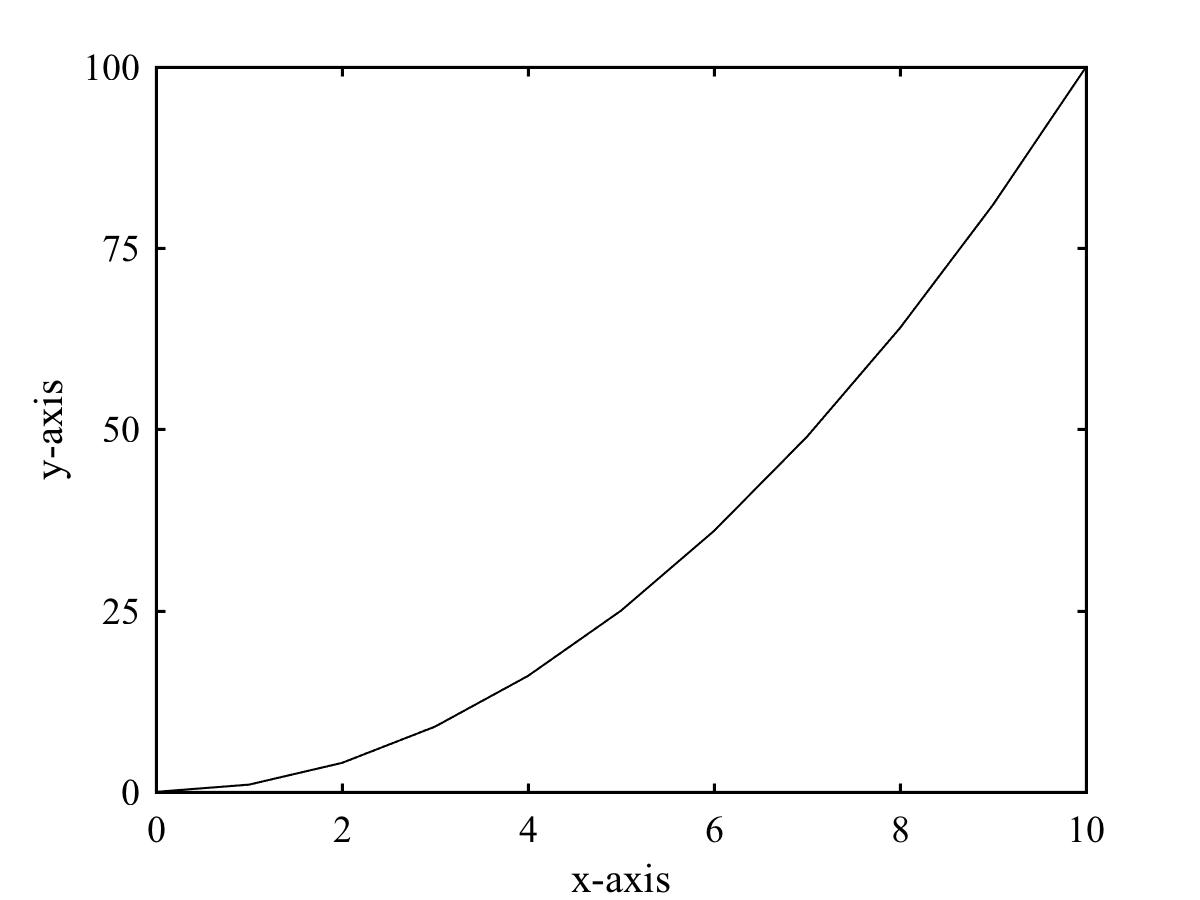
The finished product looks particularly good in papers written in LaTeX. Happy plotting!